CFO
Reports performance to the board each quarter and wants a peer comparison the board recognizes.
NineFive builds a custom peer report for your bank each quarter: your performance benchmarked against a peer group you define, on the profitability, growth, margin, credit, and capital metrics your board actually tracks. It replaces the generic UBPR peer group and the slide someone rebuilds by hand every quarter.
Every quarter
Refreshed after call report data posts
Your peer group
A named list or criteria you set, kept current
Board-ready
Charts, narrative, and quarter-over-quarter trend
A quarterly report that benchmarks your bank on the metrics your board tracks, against a peer group you choose, with a written read on what changed.
A named list of specific competitors, or a set of criteria such as asset size, geography, loan mix, and funding profile, kept current as banks are acquired or cross a size threshold.
Profitability, margin, efficiency, growth, credit quality, reserve coverage, capital, and deposit cost, built around what your board reviews rather than a fixed template.
A short narrative on where the bank moved against peers this quarter and why, so the report explains itself.
Quarter-over-quarter movement against the peer group, with an optional deposit and branch market share view for the markets you operate in.
Reports performance to the board each quarter and wants a peer comparison the board recognizes.
Wants to see where the bank leads and trails its real competitors, not a generic size cohort.
Wants a consistent quarterly read on how the bank stacks up.
Uses the peer set to track potential partners and targets over time.
You define the peer group and the metric set with NineFive. Each quarter, after call report data posts, NineFive builds the report in BankCore, writes the narrative on what changed, and delivers a version ready for the board packet.
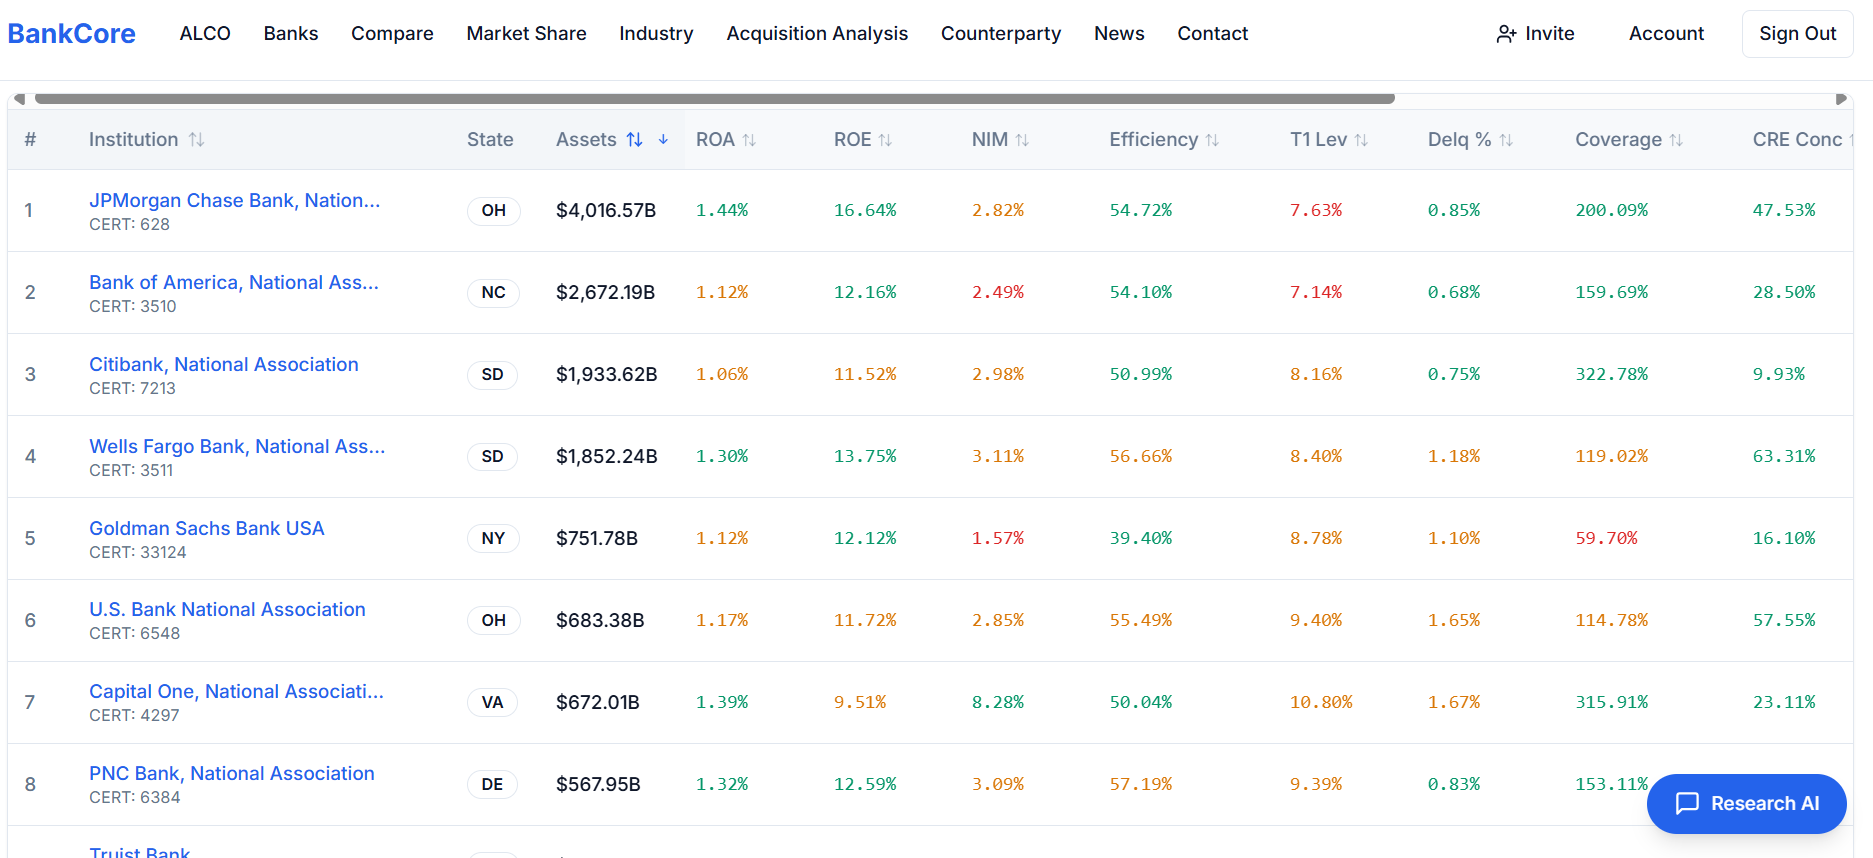
A custom peer report benchmarks your bank against a peer group you define, on the metrics your board actually tracks, and refreshes every quarter. NineFive builds it from call report and UBPR data in BankCore, with board-ready charts, a written narrative on what changed, and a quarter-over-quarter trend.
The UBPR assigns every bank to a peer group by asset size and a few other factors. It is useful but generic. A custom peer report lets you pick the banks or the criteria that actually reflect your market, business model, and strategy.
You choose it with NineFive, either as a named list of specific banks or as a set of criteria such as asset size, geography, loan mix, and funding profile. NineFive keeps the group current as banks are acquired or cross a size threshold.
ROA, ROE, net interest margin, efficiency ratio, loan and deposit growth, loan mix, credit quality, reserve coverage, capital ratios, Tier 1 leverage, CRE concentration, and deposit cost, among others, built around the metrics your board tracks.
Each report is built after the quarter's call reports are filed and the FFIEC and FDIC publish updated figures, so it reflects the latest available data for every bank in the group.
Tell us your bank and a few peers, and we will show you the comparison your board would see each quarter.