Chief lending officer
Enforces one pricing methodology, prices every deal to a target return on equity, and reports pipeline and booked ROE without a spreadsheet.
Community bank CFOs, chief lending officers, and treasurers use TrueNIM to price each loan against current market rates instead of a static rate sheet, quantify the value of the deposit relationship, and see the effect on net interest margin, capital, and liquidity before the loan is booked. It replaces the pricing spreadsheets and rate-sheet guesswork most banks still rely on, so margin is defended one deal at a time.
TrueNIM is a loan pricing and net interest margin simulation engine that community banks use to price individual loans to market, value the full customer relationship, and forecast the balance-sheet impact of new lending before the deal is booked.
TrueNIM prices each loan against current market rates and the bank's own cost of funds, target return on equity, and provision for expected losses. Every lender and branch prices the same way, so a quote can be explained to a borrower, a credit committee, or an examiner.
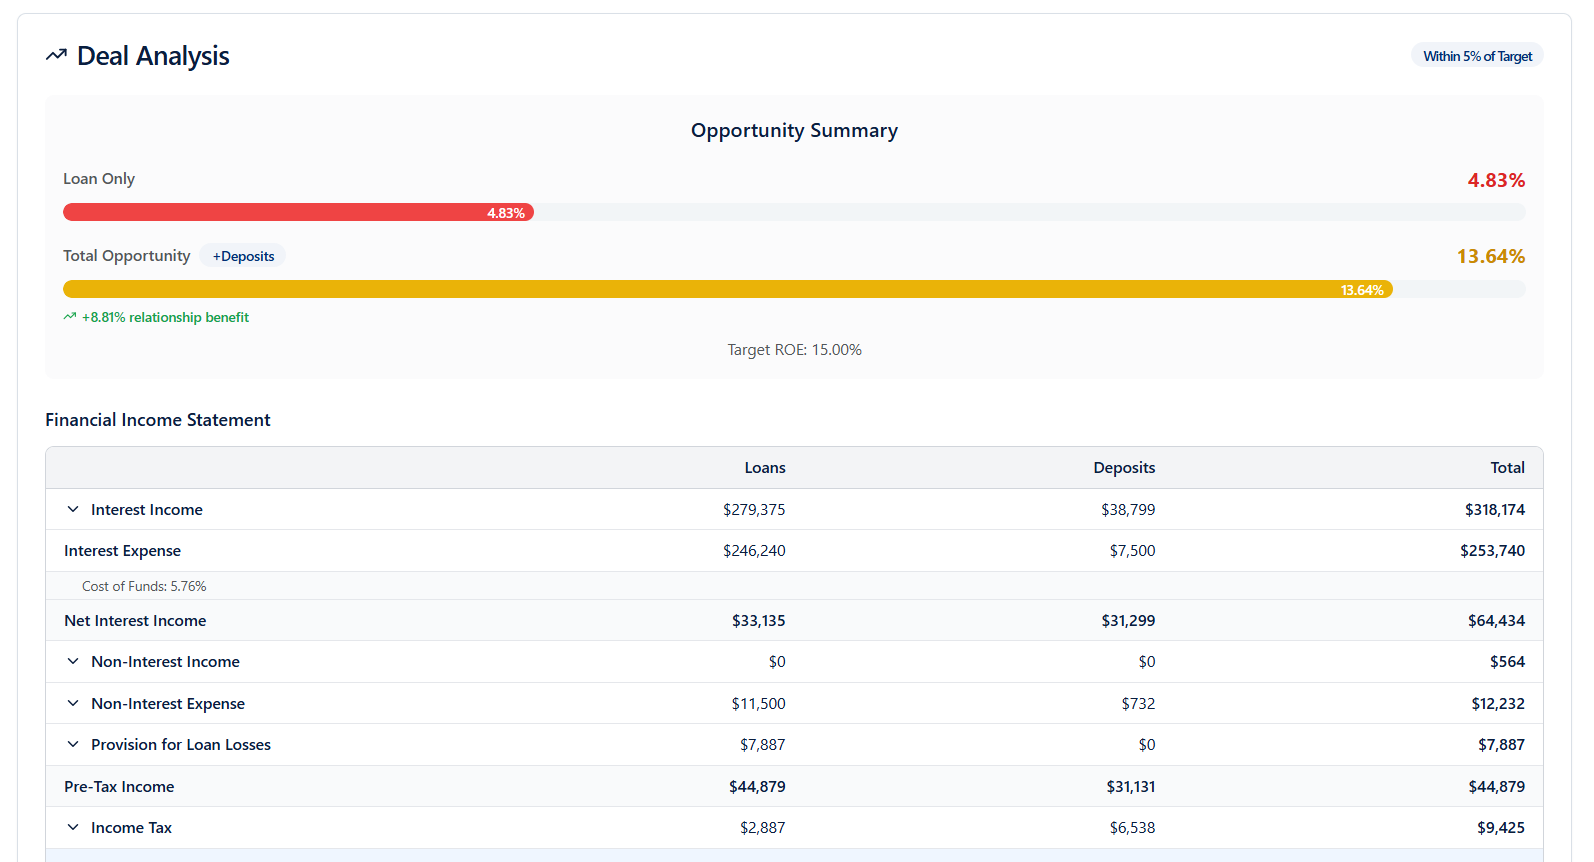
TrueNIM shows loan-only return next to total-relationship return and quantifies the deposit benefit, so a relationship deal that looks thin on the loan alone is judged on its full economics.
TrueNIM simulates rate shocks and curve shifts against real deals, so the projected net interest margin impact of the pipeline is built from the loans the bank is actually pricing, not portfolio averages.
TrueNIM forecasts how each new loan moves economic capital, Tier 1 leverage, and liquidity, so the balance-sheet effect is visible before the loan is funded rather than after the quarter closes.
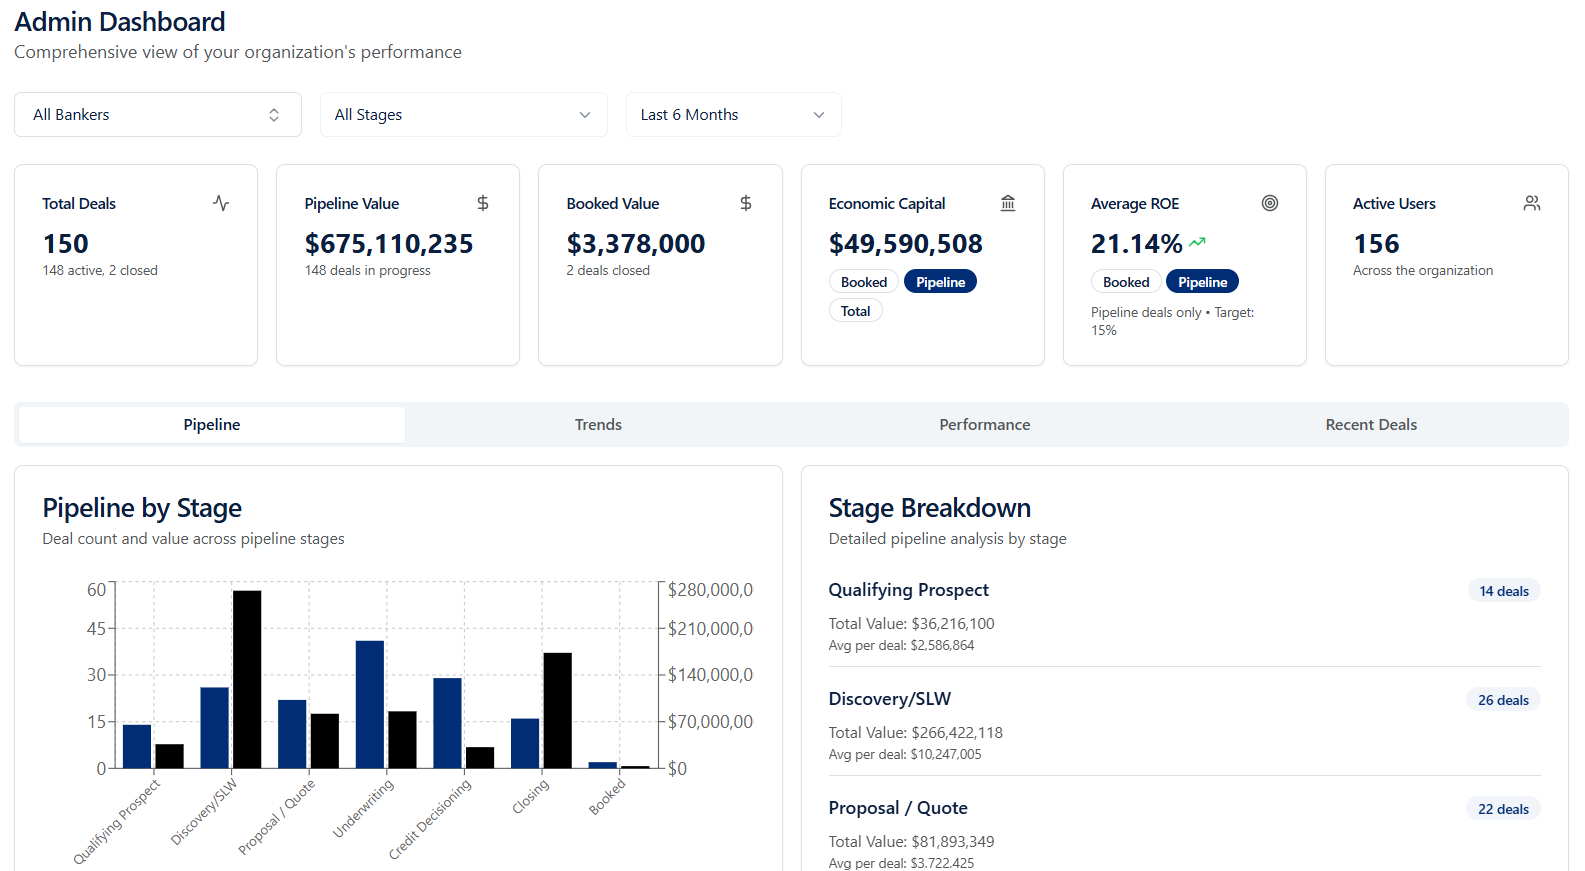
TrueNIM gives lenders, credit, the CFO, and ALCO one view of pipeline value, booked value, stage, and average ROE against target, filterable by banker or period, so leadership does not ask for a status update.
To date, more than $1.2 billion in deal volume has been priced through TrueNIM, and the platform generated $215 million in loan volume in its first year. See how this connects to the rest of the balance sheet in BankCore.
Most banks price loans off a rate sheet and a gut check. That holds until the curve moves, funding costs shift, or a competitor prices something the bank cannot explain. By the time it shows up in the margin, the loan is already on the books, and the next quarter is spent explaining what happened to NIM instead of managing it.
Enforces one pricing methodology, prices every deal to a target return on equity, and reports pipeline and booked ROE without a spreadsheet.
Sees the margin, ROA, and ROE impact of the pipeline before it books, and defends net interest margin to the board with current numbers.
Ties loan pricing to the bank's cost of funds, deposit beta, and liquidity, so pricing and funding assumptions match.
Works from one pricing posture and one pipeline view in the quarterly meeting instead of three versions from three teams.
Quote a rate knowing it clears target, with the deposit relationship already counted in.
See loan-only pricing next to full relationship pricing side by side, with the deposit relationship benefit called out in basis points. Every lender quotes a rate that pencils against the bank's target return.
Total deals, pipeline value, booked value, economic capital, and average ROE in one view, filterable by banker, stage, or time period, so leadership never has to ask for a status update.
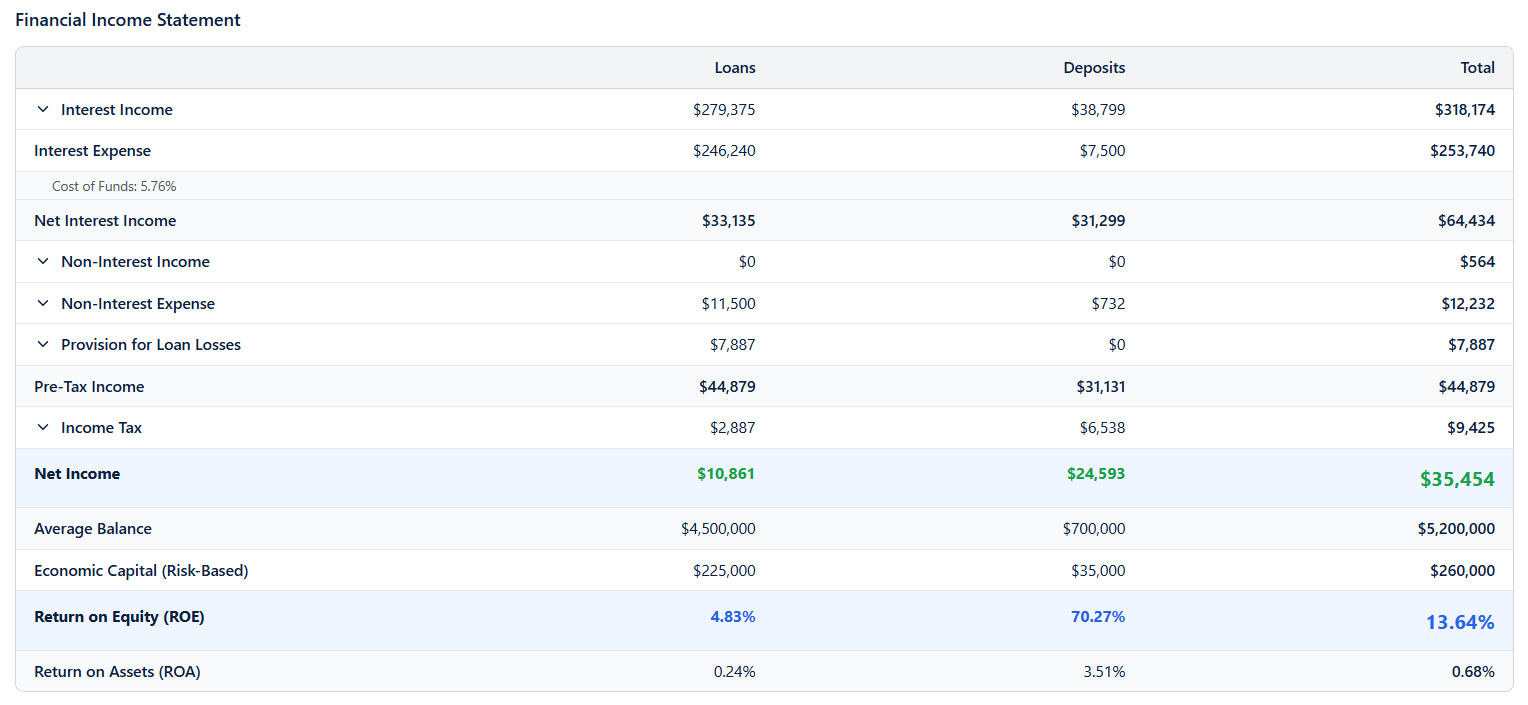
Interest income, interest expense, provision for loan losses, and net income, split between loans and deposits, down to ROE and ROA, generated for every deal without a spreadsheet.
Price every loan against a defensible, best-practice methodology instead of a static rate sheet, so every quote reflects where the market is today, not where it was last quarter.
Give lenders, credit, and ALCO one live view of what is in the pipeline, including pricing, terms, and projected impact, instead of reconstructing it from someone's spreadsheet before every meeting.
See how every new loan moves your capital and liquidity position before it is funded, not after it shows up in next quarter's call report.
Simulate rate shocks and shifts before they happen, and see the margin impact on your book today, so you can defend net interest margin instead of explaining what happened to it.
Loan-level net interest margin simulation prices and models each loan on its own terms, using its rate, term, amortization, structure, funding cost, and expected losses, rather than modeling the loan portfolio in aggregate. TrueNIM uses this approach so a lender sees the margin and return of a specific deal before quoting it, and so the projected NIM impact of the pipeline is built from real deals rather than portfolio averages.
TrueNIM prices the loan and the associated deposit relationship together. It calculates loan-only return next to total-relationship return, and quantifies the deposit benefit in basis points, so a relationship deal that looks thin on the loan alone can be judged on its full economics. Cost of funds and a provision for expected losses are built into every calculation.
No. TrueNIM prices the loan and shows its balance-sheet effect before the deal is booked in your loan origination system or core. It runs alongside those systems rather than replacing them.
No. TrueNIM prices individual loans at the point of sale and forecasts the pipeline's margin, capital, and liquidity impact. If your bank runs a portfolio asset-liability model for regulatory reporting, TrueNIM runs alongside it and feeds it deal-level pricing assumptions built from real loans.
TrueNIM prices the commercial and consumer loans a community bank books, including term loans and lines of credit, using each loan's rate, term, amortization, and structure. Contact NineFive to confirm coverage for a specific loan type or structure.
Implementation takes weeks, not months. NineFive configures the pricing methodology and funding assumptions with your team and imports the data TrueNIM needs.
More than $1.2 billion in deal volume has been priced through TrueNIM, and the product generated $215 million in loan volume in its first year.
Bring a handful of recent deals, and we will show you exactly how TrueNIM would have priced them, and what it means for your margin.